
Clearly not in terms of the worldwide stage but perhaps from the UK and Wales perspective, to quote Churchill, “Now this is not the end. It is not even the beginning of the end. but it is, perhaps, the end of the beginning.” As an ex-military man, I am struck by where we are currently but also as I write on this Remembrance Day I am reminded this 11th November is also the 100th anniversary of the return of the Unknown Warrior to Westminster Abbey, so perhaps military quotes are in order. I also wonder how history will remember this pandemic and those killed by it in 100 years.
The effects of this pandemic remain awful and for those families where the virus has killed their relatives, I’m sure any that read my words in many of my articles may well be upset and angry and for that I apologise.
That being said, in truth I have been suggesting since July that we were at, “the end of the beginning,” which I hope this article will explain.
Viral transmission is a complex business and I suspect we only understand some of what happens. Clearly it is possible to study all stages of viral infection in the laboratory but as we have explored before, health is a complex adaptive system and there is so much that we still do not know. A couple of articles I have been reading to try and get my head around viral transmission are available via these two links:
General article: https://www.ncbi.nlm.nih.gov/pmc/articles/PMC7148619/
Host genetics: https://www.ncbi.nlm.nih.gov/pmc/articles/PMC6856216/
In my first coronavirus article in April, I discussed the iceberg analogy that presents the human population as an iceberg and it worth at this stage revisiting the model in the current context. In April, we recognised that the tip of the iceberg were those individuals who would get severe disease and end up being admitted to hospital. This group included those at risk of dying of the new coronavirus infection. This is the top 20% but the bulk of the iceberg above the waterline represents the 80% of coronavirus infections that are minor and are managed at home as discussed in the WHO China mission report.

What was unclear in March/April was the proportion of the population that are under the waterline and make up the bulk of the population iceberg. In April, while the WHO China report initially suggested few asymptomatic infections, information was emerging from Italy that there were indeed asymptomatic infections. The most recent information from UK data published last month is suggesting that 75% of individuals have an asymptomatic infection.
Thus, three quarters of the infected population are below the waterline and 25% make up the symptomatic proportion above the waterline. In March/April, the only people who were being tested were one fifth (20%) of the population above the waterline who because of the severity of their illness, were admitted to hospital. Therefore, in real terms the case numbers being reported up to July when we began to develop plans for re-opening the NHS can be multiplied by 5 for the complete 100% of symptomatic infections and then by 4 to capture the remaining asymptomatic infections. Charts of the entire pandemic so far showing test positivity, severely underestimate the position in the early phase.
Once the peak of infection in March/April was over, we saw the benefit of imposed social distancing of the lockdown with a longer tail of infections. With the release of lockdown, social mixing was inevitably going to allow for the emergence of new infections, as I discussed in the post COVID-19: Where next?
In the meantime, we began to increase access to testing and even were obliged to do what was not offered in previous pandemics and out of a sense of concern I suspect on the part of our politicians, started testing asymptomatic residents and staff in our care homes. Similarly, So with increased testing of symptomatic individuals but also a lot of asymptomatic individuals, the stage was set for an apparent massive “second wave.” As has been pointed out by many commentators however, this excess of testing capacity means we are now testing very differently to March/April. The claim that somehow the virus is now affecting the young misses the point that many young were being infected in March/April but we were simply not testing them because the majority had illnesses that did not require admission to hospitals and access to the limited testing available at that time.
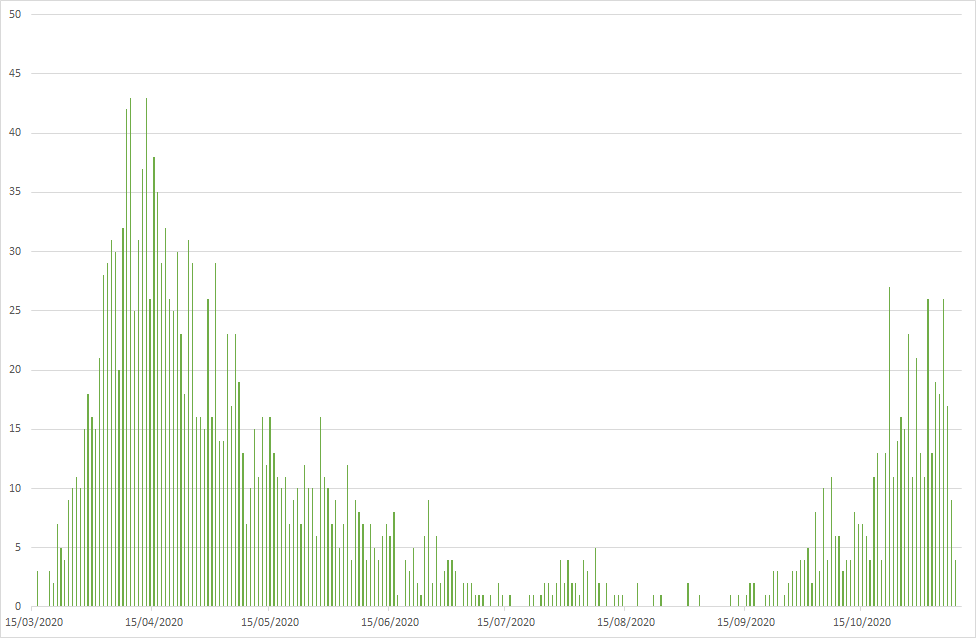
The only data that allows for comparison between what was happening in March/April compared to now, are the hard data relating to symptoms and death, the same data that has been used in all the previous pandemics of the past 100 years. The UK and for our part Welsh data shows a large peak of deaths in March/April, a lower peak now.
As I did previously, I have again downloaded an update of the Excel file published daily by Public Health Wales. The data in the file only records those tests performed by the Welsh NHS. Each test is allocated to local authority but there are also tests for people outside Wales as well as those with no address recorded. As I am primarily interested in exploring Wales only, the daily tests for people outside Wales, I removed but retained those without an address, anticipating most would be expected to be Welsh residents. My plot of deaths from the data file looks like this:
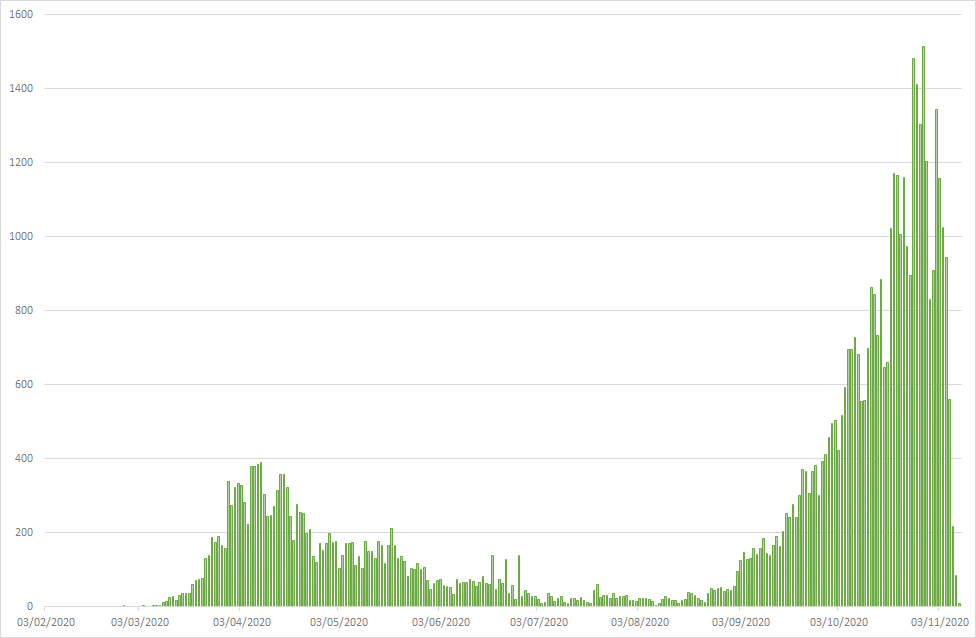
While my plot of positive results looks like this:
However, I asked myself, “How might the plot of cases look if each day we were able to test the same number of samples as the day with the highest number of tests?” In the download dated 9th November 2020, the largest number of tested samples in Wales was on 6th October 2020 and was 8,573 tests.
For every day in the series I took the number of positive tests on each day, divided by the number of tests performed on that day and multiplied by 8,573. With so few tests being undertaken in March/April, the multiple was large and many more times than 1. With the more recent dates, the multiple is very close to one. I then plotted these numbers:
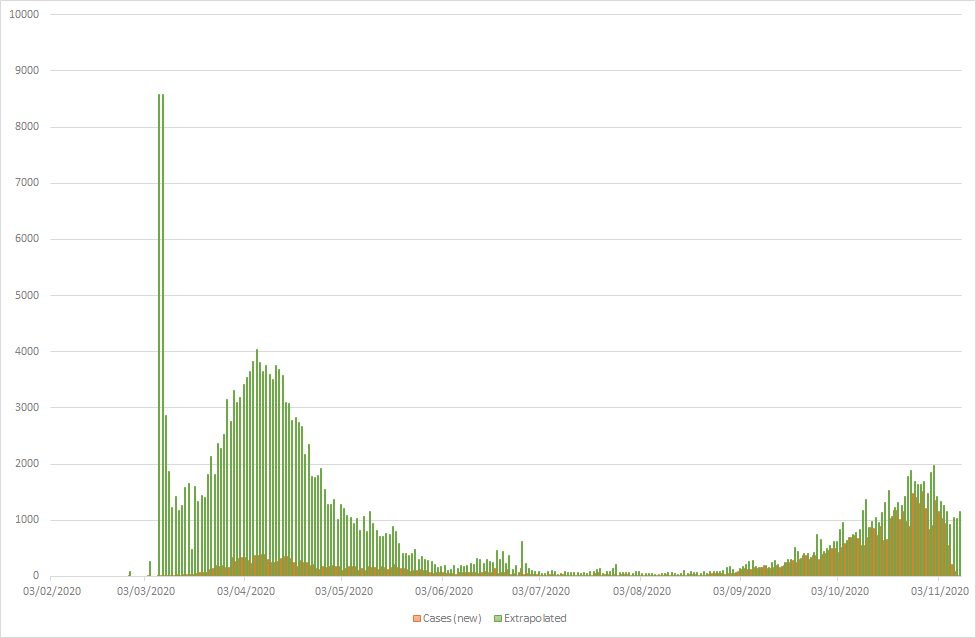
Looked at in this artificial way, we see that the shape of the curve is similar to that for deaths, with a very large peak at the start. The apparent large numbers as the start relates to the very low numbers of samples being taken, before testing was available in Wales. Samples being sent to the Public Health England lab at that time and reflects the low numbers being submitted: on 7th March, 2 samples were sent and both were positive; on 8th March, 1 sample was sent and it was positive. The positivity rate was therefore 100% and extrapolates to the maximum number of samples I have used i.e. 6th October: 8,573.
Two recent reports have been issued by the symptom reporting data sets: the Zoe App and the Office for National Statistics. Both studies recently suggested the peak of the second wave has been reached and that numbers of symptomatic cases now are at the plateau or falling. I also noted with interest an assessment by Richard Lister (@RP131 on Twitter), that the case number in Liverpool has been falling since early October. He really is worth a follow for independent scrutiny of the data.
Wales has had the benefit of the two week firebreak. Our case numbers inevitably follow England and numbers will appear to decline as a result of the newly imposed one month lockdown, the ONS reported the decline in cases on the same day that England started its lockdown.
If 75% of infected individuals in our iceberg are below the waterline, how many people below the waterline are not affected? While theoretically all individuals should have been naïve to this virus at the start of 2020, undoubtedly a significant proportion of the worlds population will seem unable to mount evidence of infection with this virus. In the 1918 pandemic, the History site quotes 1/3 of the population or 500 million cases of the H1N1 Influenza. I tend to increase this figure to 600 million as the estimate for 1918 population in the article below quotes a worldwide population of 1.8 billion: “The Spanish flu (1918-20): The global impact of the largest influenza pandemic in history.”
Now in 1918, science had not discovered viruses, so this 1/3 of the world being infected means clinical cases. Influenza viruses can also cause asymptomatic infections but would the remaining 2/3 have been infected? This is not clear and certainly is not clear with the current coronavirus but I would anticipate there will be many who will meet this virus but for some reason, will not appear to get infected. This will be a reflection of multiple variables associated with the transmission dynamics I mentioned at the start.
The 1918 pandemic still is the largest in history, with a minimum of 20 million deaths – some estimates go as high as 80 million. The current pandemic is nowhere near these figures yet. I use: https://www.worldometers.info/coronavirus/ for a regular review of worldwide and country specific figures. As I write, the case number currently stands at 53,037,854 and deaths 1,298,191. However, the worlds population from the same website today is 7,825,018,100 so to match the 1918 pandemic, this one would have to reach around 2,608,340,000 cases and 87,000,000 deaths. This is very far from where we are currently but of course there is still a lot of this pandemic to play out and while the world picture is showing no evidence yet of a decline, that is probably a reflection of different countries being at different stages of their cases.
To me, as I suggested at the start of this article, this current wave is lower that the first; we are being seduced by graphs that are not showing comparable data. If the current declines continue, which they should based on the primary peak, then in Wales we should anticipate by Christmas we will be back in a lull. As the First Minister predicted, we might see a further increase sometime in January or February. However, based on these first two peaks, I would anticipate the next will be lower again. I described this in a recent meeting as consider it like skipping a stone over a pond, with each subsequent bounce being of lower intensity. And to illustrate that, I could not let this opportunity pass:
All that being said, this is where my mulling this all over has got me to; I could be wrong and if I am, I offer my apologies now but for my part, I’m planning for a Happy Christmas!
(A copy of the datafile, including charts above is available here. Colleagues seeking to access the file from an NHS resource may find their access blocked by NHS Wales rules – try via home/own pc or smartphone/tablet)
Leave a Reply